and Mears35
  were both satisfied as well, confirming the absence of mass and heat transfer effects in all
measurements.
were both satisfied as well, confirming the absence of mass and heat transfer effects in all
measurements.
The utilization of glycerol, primary byproduct of biodiesel production, is important to enhance process economics. In our recent prior work, it was shown that glycerol can be converted to hydrocarbon fuels over bifunctional catalysts, containing a noble metal supported on H-ZSM-5. Over Pd/H-ZSM-5 catalyst, an optimal ~60% yield of hydrocarbon fuels was obtained. In the present work, based on experimental data over Pd/H-ZSM-5 catalyst, a lumped reaction network and kinetic model are developed. Using differential kinetic experiments over the temperature range 300-450 ∘C, the rate constants, reaction orders and activation energies are obtained for each reaction step. The predicted values match well with experimental data for glycerol conversion up to ~90%.
Glycerol, Kinetics, Bifunctional Catalyst, Aromatization, Hydrodeoxygenation
With the growing demand for renewable energy sources in recent years, biofuels have emerged as promising alternatives to fossil fuels. In this context, in addition to being an energy source, biodiesel also plays an important role in decreasing the global CO2 footprint.1 As reported recently, biodiesel from soy oil can result in 57% reduction of greenhouse gases as compared to petroleum diesel, while the corresponding decrease using waste grease is 86%..2,3,4
In biodiesel manufacture, about 10 wt% crude glycerol is generated as an undesired byproduct. The enormous increase in global production of biodiesel has resulted in a large surplus and low price of crude glycerol, which was about 1 cent per lb at the end of 2014.5,6 To enhance biodiesel industry economics, therefore, it is important to utilize the byproduct crude glycerol,7,8 for which the purification process is typically employed as the initial step. There are several methods for this step, including a universal procedure described recently which can purify crude glycerol from a variety of biodiesel plants yielding essentially pure glycerol.9
Hydrocarbon fuels, including gasoline and diesel, provide high energy density and ease of transportation, playing an important role in the current global energy supply. With its current cheap and ready availability, conversion of glycerol to hydrocarbon (GTH) fuels would increase the economic value of glycerol and provide an additional bioenergy source. In our recent work,10 bifunctional catalysts (Pt/H-ZSM-5 and Pd/H-ZSM-5) were selected, prepared, characterized, and tested for GTH conversion. Under optimal conditions, about 90% glycerol conversion and 60% yield of aromatic hydrocarbons were achieved over Pd/H-ZSM-5 catalyst. A mechanism of sequential hydrodeoxygenation and aromatization was proposed for GTH conversion. Similar works, using catalysts such as PdO/H-ZSM-5, Zn/H-ZSM-5 and Sn/H-ZSM-5, have also been reported.11,12,13,14,15
The GTH conversion is a complex process, involving more than 20 species, such as acetaldehyde, propenal (acrolein), hydroxyacetone, ethylene and C6-C8 aromatic hydrocarbons. The reaction pathways, including dehydration, dehydrogenation/hydrogenation and oligomerization, have been proposed.14,15 To our knowledge, however, kinetic studies of GTH conversion have not been reported previously. For such complex reaction networks, containing a large number of chemical species, lumped kinetic models are typically developed to represent the overall reaction pathways,16,17,18,19,20,21 which can be further used for reactor design and process scale-up. In the present study, based on our prior work,10 differential kinetic experiments of GTH conversion are reported, a lumped kinetic model is developed, and reaction mechanism is discussed.
Palladium (II) nitrate hydrate (99.8% metals basis), from Alfa Aesar, was used as the Pd metal precursor. ZSM-5 (Si/Al=40) of ammonium form was supplied by Zeolyst International. Pure glycerol (ACS grade) and 37 wt% HCl were obtained from Mallinckrodt Chemicals. The chemical standards, including acetaldehyde, benzene, cumene, ethylene, hydroxyacetone, propanal, acrolein, propylene, toluene, m-xylene, o-xylene and p-xylene, were from Sigma Aldrich. Ultrahigh purity grade gases (H2, He, O2, N2 etc.) were purchased from Indiana Oxygen.
The ammonium form of ZSM-5 (Si/Al=40) was converted to its H-form (H-ZSM-5) by calcining in air at 500 ∘C for 4 hours.22,23 The catalyst was prepared by impregnation method. Briefly, Pd precursor was dissolved in deionized water, and added dropwise to the well stirred H-ZSM-5 slurry, with pH=5.6 and stirring continued for at least 8 hours at room temperature. The slurry was then rinsed and dried in air at 100 ∘C. The Pd loading was 5 wt%. In later sections, metal loading and Si/Al ratio in H-ZSM-5 are not noted explicitly when describing the catalyst. Thus, Pd/H-ZSM-5 refers to 5 wt% Pd loaded on H-form of ZSM-5 with a Si/Al ratio of 40.
Since the same Pd/H-ZSM-5 catalyst, as in our prior publication,10 was used in the present work, results of catalyst characterization, including BET specific surface area, mean pore diameter, Pd metal dispersion (by H2-O2 titration24), Pd particle size, AEC-ICP element analysis, NH3-TPD, transmission electron microscopy (TEM), X-ray photoelectron spectroscopy (XPS) and X-ray powder diffraction (XRD), can be found in that publication and its Supplementary Information. Briefly, the high BET surface area (437 m2/g) and moderate mean pore diameter (about 0.5 nm) of Pd/H-ZSM-5 indicates good accessibility of reactants (e.g. glycerol, acrolein and olefin gases) over Pd/H-ZSM-5 catalysts. Both surface area and mean pore diameter data are consistent with those reported in the literature.25,26 The Pd particle sizes provided by TEM (3.8 nm) and H2-O2 titration (3.2 nm) techniques are consistent, corresponding to Pd metal dispersion of 23-30%. The XRD patterns for Pd/H-ZSM-5 are similar to unsupported MFI (ZSM-5), as reported in the International Zeolite Association (IZA) structure database.27 No Pd peaks were identified, likely due to high metal dispersions and low metal loading.28 The NH3-TPD measurements showed a Brønsted acid peak at about 650 K.23
The experiments were conducted in a continuous fixed-bed reactor system, described in our prior work.10 The catalysts were packed in a stainless steel fixed-bed reactor (with internal diameter 10 mm). Prior to kinetic measurements, catalysts were activated at 400 ∘C, 1 atm for 4 h under a gas mixture (25% H2, 75% N2) flow. Feedstocks were heated to their boiling points to ensure evaporation prior to being pumped by an IP 25 Isocratic pump from Dionex into the reactor. The product mixture was condensed in a dual-wall glass condenser, cooled by propanediol circulation (to -20 ∘C) controlled by a circulator (Thermo Haake C10). The liquid products were collected every 10 min and then analyzed, while the gaseous products were analyzed on-line every 5 min. The standard operating conditions were 400 ∘C, 1 atm total pressure, 0.05 g catalyst, mixed gas of N2 and H2 at flow rates 100 mL/min and 50 mL/min respectively, and pure glycerol feed rate 0.6 mL/h (liquid, at room temperature). Based on the standard operating procedure, to obtain kinetic data under various conditions, parameters including temperature, reactant feed flow, catalyst packing amount were varied. All experiments were conducted under excess hydrogen flow (feed molar ratio of H2 to glycerol ~ 10). A blank test with packing inert material (amorphous SiO2), instead of Pd/H-ZSM-5, was conducted under the standard reaction conditions. It was found that glycerol conversion was < 1%. All experiments have mass balances of 90 ± 3%, consistent with the literature.29 Possible factors affecting mass balance include liquid hold-up in the reactor, condenser and tubing. All kinetics measurements were conducted under differential conditions, corresponding to 5-10 % conversion. All experiments were repeated at least twice.
The products from GTH process split into three phases: non-condensable gaseous, upper organic liquid and lower aqueous liquid, which were analyzed by three different instruments. The gases were analyzed by a micro-GC (Agilent 3000A) equipped with a thermal conductivity detector, a Mol-Sieve 5A column and a Plot U column. The organic liquid products were analyzed by an Agilent GC 6890 equipped with flame ionization detector (FID) and a DB-WAX (30 m × 0.32 mm) column, while the aqueous liquid samples were analyzed by an Agilent GC 5890 equipped with a FID and Select Biodiesel for glycerides ultiMetal Column (15m × 0.32 mm, ID=0.10 mm) and a retention gap. Calibration was performed for all the components.
As described in our prior work,10 oxygenates (acrolein, acetol, etc.) were primary products when unsupported H-ZSM-5, Pd/SiO2 (amorphous) and Pt/SiO2 (amorphous) were used as catalysts, although the use of H-ZSM-5 promoted the formation of target products, aromatic hydrocarbon fuels. The addition of noble metal Pd to H-ZSM-5, as compared to unsupported H-ZSM-5, enhanced yield towards aromatics and decreased the selectivity to oxygenates (see Table 1), where selectivity of a component refers to the production rate of that component per unit consumption rate of glycerol. In our prior work, the metal and acidity of ZSM-5 effects were discussed. Briefly, it was concluded that GTH conversion follows sequential hydrodeoxygenation (HDO) and aromatization steps, promoted by metals (Pd or Pt) and acidic H-ZSM-5 support. Thus, surface Pd and acidic sites of H-ZSM-5 are proposed as the active sites. The operating conditions, including temperature, H2 partial pressure, glycerol feed flow rate and catalyst packed amount, were also varied and optimized in our prior work. The optimized parameters were used as the standard conditions in the present work.
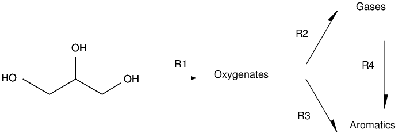
Since the only carbon containing species in the feed was glycerol, all three carbon containing products (oxygenates, gases and aromatics) derived from it. As shown in Figure 1, the partially deoxygenated products, oxygenates, are proposed as intermediates resulting in the fully deoxygenated products - gases and aromatics, as also suggested by others.14,15 This leads to the proposed steps R1, R2 and R3. Further, as reported in the literature,30,31,32 gases can be converted over ZSM-5 type zeolites to aromatics, thus step R4 is included in the reaction network. In summary, oxygenates are first formed from glycerol (step R1), followed by formation of aromatics either directly (step R3) or indirectly via gases (steps R2 and R4).
Before conducting the kinetic measurements, using well known procedures, the plug flow condition was
confirmed by satisfying the criteria proposed previously.33 Specifically, the reactor diameter is more than
10 times the catalyst particle diameter, while the catalyst bed height is more than 50 times the catalyst
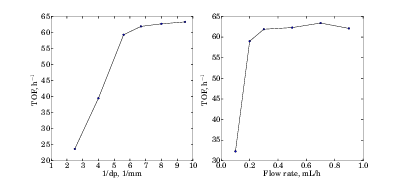
particle diameter. The absence of internal/external mass transfer limitations was also confirmed
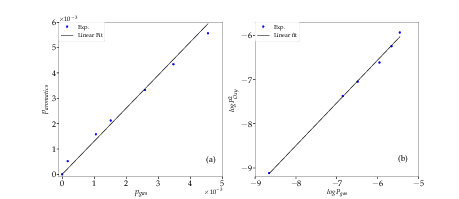
(Figure 2). By varying only packed catalyst particle diameter (dp) in the range 100 micron < dp < 1000
micron, Figure 2(a) was obtained. It shows that when dp < 150 micron (corresponding to 100 mesh),
internal mass transfer effect was negligible. Figure 2(b) was obtained by varying feed flow
rate, while keeping other operating conditions, including contact time (W/F), unchanged. It
indicates that for feed flow rate > 0.4 mL/h, no significant external mass transfer effect exists.
Thus, dp < 150 micron and feed flow rate > 0.4 mL/h were used in the kinetic experiments.
Further, the criteria by Weisz and Prater34 and Mears35
were both satisfied as well, confirming the absence of mass and heat transfer effects in all
measurements.
In the reaction pathways shown in Figure 1, each step (R1-R4) contains more than one elementary reaction. For example, step R1, when converting glycerol to acrolein, involves two sequential dehydration reactions,36,37,38 while more complex reactions (e.g. hydrogenation, dehydrogenation, deoxygenation, etc.) occur when other oxygenates are produced.14,15,39 Step R2 includes deoxygenation, dehydrogenation and C-C bond cleavage reactions, while step R4 includes oligomerization, cyclization and dehydrogenation. Step 3 refers to pathways where C1-C3 gases do not exist. Thus the overall GTH conversion comprises a complex network, which can be reduced to a few equivalent lumped reactions: steps R1-R4. As lumped pseudo-components, oxygenates represent a mixture of acetaldehyde, propanal, acrolein and hydroxyacetone. Gases represent a mixture of methane, ethylene and propylene, while aromatics refer to C6-C12 aromatic hydrocarbons.
The reaction rate of step Ri is defined by Eq. (1).
 | (1) |
Since all kinetic measurements, as described in the experimental section, were conducted under differential operating conditions (conversion 5-10%), the reaction rate is calculated by Eq. (2).
 | (2) |
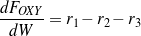
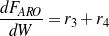
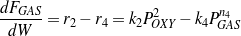
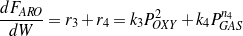
The consumption/formation rates of glycerol and lumped components (oxygenates, gases and aromatics) are given by Eqs. (3 - 6).
 | (3) |
 | (4) |
 | (5) |
 | (6) |
Note that among the four Eqs. (3 - 6), only three are independent. An overall material balance yields the following Eqs. (7 - 8).
 | (7) |
 | (8) |
Since excess H2 (molar ratio of H2 to glycerol ~10) is used in all cases, H2 pressure effect was considered as a constant contribution to the reaction rates. Kinetic measurements were carried out at various temperatures in the range 300-450 ∘C. Although only results at 400 ∘C are shown below, since it gives optimum aromatic yields,10 fitting results for other temperatures gave essentially the same conclusions.
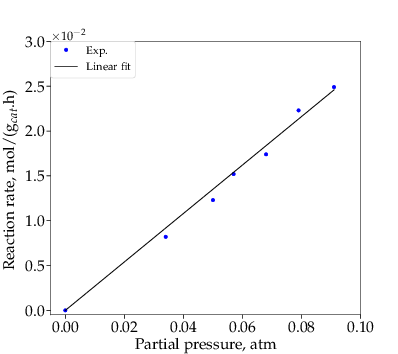
When glycerol was fed as reactant, under differential operating conditions, all lumped components (oxygenates, gases and aromatics) were detected. By varying glycerol feed flow rate, its consumption rate corresponding to its average bed partial pressure, was measured, as shown and fitted in Figure 3.
Being the first step of the network, the consumption rate of glycerol depends only on glycerol partial pressure. Since a linear fit works well, step R1 appears to be first-order, which is consistent with the literature.39,40,41,42 Thus, Eq. (3) can be rewritten as Eq. (9).
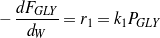 | (9) |
From slope of the line in Figure 3, the value of k1 at 400 ∘C is 0.278 mol∕(gcat⋅h⋅atm).
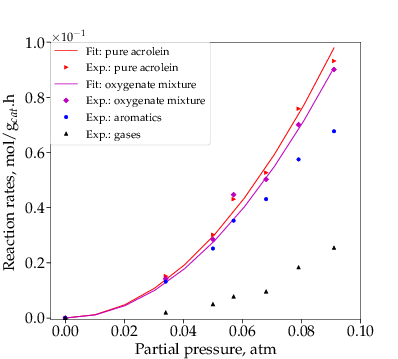
In the above section, the rate constant and reaction order of step R1 were obtained by feeding glycerol in a differential reactor, controlling its conversion in the range 5-10%. To study the rate constants and reaction orders of steps R2-R4, still under differential operating conditions, oxygenates were used as feed. The oxygenates, based on the compositions reported in our prior work,10 were represented by a mixture of acetaldehyde, propanal, acrolein and acetol. Because acrolein was found to be the primary component (60-93%), pure acrolein was also tested as feed. As shown in Figure 4, both pure acrolein and oxygenates curves show good second-order fits, while formation rates of gases and aromatics, corresponding to r2-r4 and r3+r4 respectively, appear to be second-order as well.
The conversion of acrolein to gases likely includes hydrogenation of acrolein to propanol, followed by propanol dehydration and other C-C cleavage reactions..43,44,45 Both first and second orders have been reported for acrolein hydrogenation.46,47 Since reaction rates starting with representative oxygenates and pure acrolein as feed, as shown in Figure 4, are close, only pure acrolein was used for further kinetic measurements, discussion and analysis.
Both gases and aromatics were detected when oxygenate conversions were lower than 10%. Since no glycerol was fed (r1=0), the consumption rate of oxygenates is dependent only on r2 and r3, as described by Eq. (4). Figure 4 shows that the overall reaction rates of r2 + r3 follow a second-order. It is assumed here (justified later) that reaction orders of steps R2 and R3 are the same, thus n2=n3=2. Eq. (4 - 6) are then rewritten as Eq. (10 - 12).
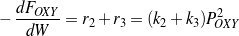 | (10) |
 | (11) |
 | (12) |
To determine reaction order of step R4 (n4) and all rate constants (k2-k4), Eq. (13) is obtained dividing Eq. (12) by Eq. (11):
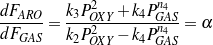 | (13) |
In Figure 5(a), the aromatics partial pressure is plotted versus the partial pressure of gases. Since a linear relation fits well, α in Eq. (13) equals a constant. Rearranging Eq. (13) yields Eq. (14), whose rhs also equals a constant, designated as β.
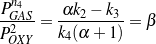 | (14) |
Taking logarithm of both sides yields Eq. (15).
 | (15) |
The plot of Eq. (15) is shown in Figure 5(b), where the fitted slope is 0.968, thus step R4 is found to be first-order.
Additional tests for reaction orders of steps R2 and R3 were carried out, such as the following data sets: n2=1, n3=1; n2=1, n3=2; n2=2, n3=1;n2=2, n3=3; and n2=3, n3=2, etc. These sets, however, always provided worse fits. Thus it is confirmed that the assumption of n2=2, n3=2 is reasonable.
To determine k2, k3 and k4, the following procedure was used. First, the value of (k2 +k3) was obtained from Eq. (10) by the best fit of the oxygenate curve in Figure 4. A second relation between k2 and k4 was obtained via Eq. (11), using the measured values of the gas formation rate. An alternative for the second relation is via Eq. (12), using the measured values of the aromatics formation rate. The third relation between k2, k3 and k4 was from the measured values of α via Eq. (13). These three relations were used to obtain the best fit k2, k3 and k4 values at 400 ∘C, shown in Table 2.
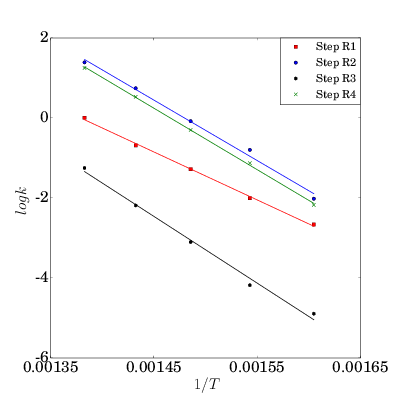
All data discussed in above sections was measured at 400 ∘C, while the reaction orders (n1-n4) remain the same when other temperatures (300-450 ∘C) are used. Reaction activation energies (Ea) of steps R1-R4 were calculated using the Arrhenius equation (16). With the reaction orders remaining the same, data for the other temperatures (300-450 ∘C) were used to obtain the corresponding ki values. The reaction activation energies (Ea) for steps (R1-R4) were then calculated by linear fits using the Arrhenius equation (Eq. 16). Good linearity was obtained for all four steps, as shown in Figure 6, and the fitted results are shown in Table 3.
 | (16) |
The activation energy of step R1 (glycerol dehydration to acrolein) has been reported over a wide range in the literature. Talebian-Kiakalaieh et al. presented a value of 27.5 kJ/mol over tungstosilicic acid catalyst,42 while Qadariyah et al. have 39.6 kJ/mol in subcritical or supercritical water (temperature 200-400 ∘C, pressure 30 MPa) without any catalyst.48 Watanabe et al. reported 146 kJ/mol at 300-400 ∘C with H2SO4 catalyst,49 while Ott et al. have 140 kJ/mol at 300-360 ∘C over zinc sulfate catalyst.50 Our result described in Table 3 is in the reported range of 27.5-146 kJ/mol. The activation energy of step R2 is smaller than that of step R3 by 26 kJ/mol, indicating step R2 dominates in the reaction pathway as compared to step R3 (see also the relative ki values in Table 2). As a series reaction, step R4, with a slightly higher activation energy, follows step R2.
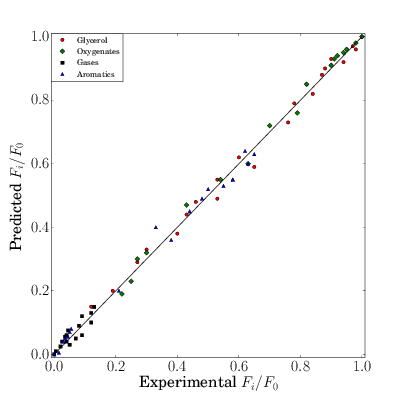
With the obtained kinetic parameters, the rates for all four steps for all the 80 experimental data points (at various temperatures, reactant feed flows and catalyst packing amounts) were calculated. The experimental and predicted flow rates for all species are plotted in Figure 7, giving an RMS error of 6.1%, indicating good fits.
In the present work, experiments were carried out for glycerol to hydrocarbon (GTH) fuels conversion over a 5 wt% Pd/H-ZSM-5 catalyst. Based on the data, the lumped reaction network was first established. The differential kinetic experiments (conversion less than 10%) were used to develop a kinetic model. The reaction orders, rate constants and activation energies for each step in the network were determined from analysis and data fitting. The model predicted values match well with the experimental results in the range of glycerol conversion up to 90%. This work provides rate expressions for the various steps involved in converting glycerol, as a biodiesel by-product, to hydrocarbon fuels.
It is a pleasure to participate in this tribute to Professor Roy Jackson. This work was supported by the R. Games Slayter Fund. AV also thanks the Department of Chemical Engineering, University of California at Santa Barbara for the kind hospitality during Winter 2017 when this manuscript was completed.
| Ai | [mol∕(gcat⋅h⋅atmni)] | Pre-exponential factor of step i when the reaction order is ni |
| Ci | [mol∕m3] | Concentration of species i |
| Deff | [m2∕h] | Effective diffusion coefficient |
| dp | [m] | Catalyst particle diameter |
| Eai | [kJ∕mol] | Activation energy of step i |
| F0 | [mol∕h] | Initial Feed flowrate |
| Fi | [mol∕h] | Flowrate of species i |
| h | [J∕ ] ] | Heat transfer coefficient |
| ki | [mol∕(gcat⋅h⋅atmni)] | Reaction rate constant of step i when the reaction order is ni |
| ni | [mol] | Reaction order of step i |
| Pi | [atm] | Partial pressure of species i |
| R | [J∕ ] ] | Gas constant |
| ri | [mol∕ ] ] | Reaction rate of step i |
| T | [K] | Reaction temperature |
| TOFi | [h-1] | Turnover frequency of step i |
| W | [g] | Catalyst packing amount |
| Xi | [-] | Conversion of step i |
| ΔHi | [kJ∕mol] | Enthalpy change of step i |
| ρcat | [kg∕m3] | Density of packed catalyst |
| Species : |
| GLY | Glycerol |
| OXY | Oxygenates |
| GAS | Gases |
| ARO | Aromatics |
References
1. Xue, J.; Grift, T. E.; Hansen, A. C. Effect of Biodiesel on Engine
Performances and Emissions. Renewable and Sustainable Energy Reviews
2011, 15, 1098 – 1116.
2. EPA, Lifecycle GHG Analysis. Renewable Fuel Standards Program
Regulatory Impact Analysis 2010, February, 474–477.
3. Al-Mulali, U. The Impact of Biofuel Energy Consumption on GDP Growth,
CO2 Emission, Agricultural Crop Prices, and Agricultural Production.
International Journal of Green Energy 2015, 12, 1100–1106.
4. Kralova, I.; Sjoblom, J. Biofuels-Renewable Energy Sources: A Review.
Journal of Dispersion Science and Technology 2010, 31, 409–425.
5. Ardi, M.; Aroua, M.; Hashim, N. A. Progress, Prospect and Challenges in
Glycerol Purification Process: A Review. Renewable and Sustainable Energy
Reviews 2015, 42, 1164 – 1173.
6. Kong, P. S.; Aroua, M. K.; Daud, W. M. A. W. Conversion of Crude and
Pure Glycerol into Derivatives: A Feasibility Evaluation. Renewable and
Sustainable Energy Reviews 2016, 63, 533 – 555.
7. Thanh, L. T.; Okitsu, K.; Boi, L. V.; Maeda, Y. Catalytic Technologies for
Biodiesel Fuel Production and Utilization of Glycerol: A Review. Catalysts
2012, 2, 191.
8. Garlapati, V. K.; Shankar, U.; Budhiraja, A. Bioconversion Technologies of
Crude Glycerol to Value Added Industrial Products. Biotechnology Reports
2016, 9, 9 – 14.
9. Xiao, Y.; Xiao, G.; Varma, A. A Universal Procedure for Crude Glycerol
Purification from Different Feedstocks in Biodiesel Production Experimental
and Simulation Study. Industrial & Engineering Chemistry Research 2013,
52, 14291–14296.
10. Xiao, Y.; Varma, A. Conversion of Glycerol to Hydrocarbon Fuels via
Bifunctional Catalysts. ACS Energy Letters 2016, 1, 963–968.
11. Hoang, T. Q.; Zhu, X.; Danuthai, T.; Lobban, L. L.; Resasco, D. E.;
Mallinson, R. G. Conversion of Glycerol to Alkyl-aromatics over Zeolites.
Energy & Fuels 2010, 24, 3804–3809.
12. Jang, H.-S.; Bae, K.; Shin, M.; Kim, S. M.; Kim, C.-U.; Suh, Y.-W.
Aromatization of Glycerol/Alcohol Mixtures over Zeolite H-ZSM-5. Fuel
2014, 134, 439 – 447.
13. Xiao, W.; Wang, F.; Xiao, G. Performance of Hierarchical HZSM-5 Zeolites
Prepared by NaOH Treatments in the Aromatization of Glycerol. RSC
Advances 2015, 5, 63697–63704.
14. Tamiyakul, S.; Ubolcharoen, W.;
Tungasmita, D. N.; Jongpatiwut, S. Conversion of Glycerol to Aromatic
Hydrocarbons over Zn-Promoted HZSM-5 Catalysts. Catalysis Today 2015,
256, 325 – 335.
15. Wang, F.; Xiao, W.; Gao, L.; Xiao, G. Enhanced Performance of Glycerol
to Aromatics over Sn-containing HZSM-5 Zeolites. RSC Advances 2016, 6,
42984–42993.
16. Nace, D. M.; Voltz, S. E.; Weekman, V. W. Application of a Kinetic
Model for Catalytic Cracking. Effects of Charge Stocks. Industrial &
Engineering Chemistry Process Design and Development 1971, 10, 530–538.
17. Jacob, S. M.; Gross, B.; Voltz, S. E.; Weekman, V. W. A Lumping and
Reaction Scheme for Catalytic Cracking. AIChE Journal 1976, 22, 701–713.
18. Astarita, G.; Ocone, R. Lumping Nonlinear Kinetics. AIChE Journal 1988,
34, 1299–1309.
19. Keipert, O. P.; Wolf, D.; Schulz, P.; Baerns, M. Kinetics of Ethane
Aromatization over a Gallium-Doped H-ZSM-5 Catalyst. Applied Catalysis
A: General 1995, 131, 347 – 365.
20. Ranzi, E.; Dente, M.; Goldaniga, A.; Bozzano, G.; Faravelli, T. Lumping
Procedures in Detailed Kinetic Modeling of Gasification, Pyrolysis, Partial
Oxidation and Combustion of Hydrocarbon Mixtures. Progress in Energy and
Combustion Science 2001, 27, 99 – 139.
21. Olcese, R. N.; Francois, J.; Bettahar, M. M.; Petitjean, D.; Dufour, A.
Hydrodeoxygenation of Guaiacol, a Surrogate of Lignin Pyrolysis Vapors,
over Iron Based Catalysts: Kinetics and Modeling of the Lignin To Aromatics
Integrated Process. Energy & Fuels 2013, 27, 975–984.
22. Chiang, H.; Bhan, A. Catalytic Consequences of Hydroxyl Group Location
on the Rate and Mechanism of Parallel Dehydration Reactions of Ethanol over
Acidic Zeolites. Journal of Catalysis 2010, 271, 251 – 261.
23. Iorio, J. R. D.;
Bates, S. A.; Verma, A. A.; Delgass, W. N.; Ribeiro, F. H.; Miller, J. T.;
Gounder, R. The Dynamic Nature of Brønsted Acid Sites in Cu–Zeolites
During NOx Selective Catalytic Reduction: Quantification by Gas-Phase
Ammonia Titration. Topics in Catalysis 2015, 58, 424–434.
24. Benson, J. E.; Boudart, M. Hydrogen-Oxygen Titration Method for the
Measurement of Supported Platinum Surface Areas. Journal of Catalysis
1965, 4, 704 – 710.
25. Serrano-Ruiz, J. C.; Dumesic, J. A. Catalytic Routes for the Conversion of
Biomass Into Liquid Hydrocarbon Transportation Fuels. Energy Environ. Sci.
2011, 4, 83–99.
26. Olson, D. H.; Kokotailo, G. T.; Lawton, S. L.; Meier, W. M. Crystal
Structure and Structure-related Properties of ZSM-5. The Journal of Physical
Chemistry 1981, 85, 2238–2243.
27. Baerlocher, C.; McCusker, L. B.; Olson, D. H. MFI - Pnma, Atlas of
Zeolite Framework Types 6th ed. Elsevier Science B.V.: Amsterdam, The
Netherlands 2007, 6th ed., 212–213.
28. Zhu, Q.; Wegener, S. L.; Xie, C.; Uche, O.; Neurock, M.; Marks, T. J.
Sulfur as a Selective ’Soft’ Oxidant for Catalytic Methane Conversion probed
by experiment and theory. Nature Chemistry 2013, 5, 104–109.
29. Jongerius, A. L.; Bruijnincx, P. C. A.; Weckhuysen, B. M. Liquid-phase
Reforming and Hydrodeoxygenation as a Two-step Route to Aromatics from
Lignin. Green Chem. 2013, 15, 3049–3056.
30. Kitagawa, H.; Sendoda, Y.; Ono, Y. Transformation of Propane Into
Aromatic Hydrocarbons over ZSM-5 Zeolites. Journal of Catalysis 1986, 101,
12 – 18.
31. Ono, Y. Transformation of Lower Alkanes into Aromatic Hydrocarbons over
ZSM-5 Zeolites. Catalysis Reviews 1992, 34, 179–226.
32. Choudhary, V. R.; Devadas, P.; Banerjee, S.; Kinage, A. K. Aromatization
of Dilute Ethylene over Ga-modified ZSM-5 Type Zeolite Catalysts.
Microporous and Mesoporous Materials 2001, 47, 253 – 267.
33. Perego, C.; Peratello, S. Experimental Methods in Catalytic Kinetics.
Catalysis Today 1999, 52, 133–145.
34. Weisz, P.; Prater, C. Interpretation of Measurements in Experimental
Catalysis. Advances in Catalysis 1954, 6, 143–196.
35. Mears, D. E. Diagnostic Criteria for Heat Transport Limitations in Fixed Bed
Reactors. Journal of Catalysis 1971, 20, 127–131.
36. Gu, Y.; Cui, N.; Yu, Q.; Li, C.; Cui, Q. Study on the Influence of Channel
Structure Properties in the Dehydration of Glycerol To Acrolein over H-zeolite
Catalysts. Applied Catalysis A: General 2012, 429-430, 9 – 16.
37. Zhang, H.; Hu, Z.; Huang, L.; Zhang, H.; Song, K.; Wang, L.; Shi, Z.;
Ma, J.; Zhuang, Y.; Shen, W.; Zhang, Y.; Xu, H.; Tang, Y. Dehydration
of Glycerol To Acrolein over Hierarchical ZSM-5 Zeolites: Effects of
Mesoporosity and Acidity. ACS Catalysis 2015, 5, 2548–2558.
38. Galadima, A.; Muraza, O. A Review on Glycerol Valorization To Acrolein
over Solid Acid Catalysts. Journal of the Taiwan Institute of Chemical
Engineers 2016, 67, 29 – 44.
39. Park, H.; Yun, Y. S.; Kim, T. Y.; Lee, K. R.; Baek, J.; Yi, J. Kinetics of
the Dehydration of Glycerol over Acid Catalysts with an Investigation of
Deactivation Mechanism by Coke. Applied Catalysis B: Environmental 2015,
176-177, 1 – 10.
40. Akizuki, M.; Oshima, Y. Kinetics of Glycerol Dehydration with WO3/TiO2
in Supercritical Water. Industrial & Engineering Chemistry Research 2012,
51, 12253–12257.
41. Talebian-Kiakalaieh, A.; Amin, N. A. S.; Hezaveh, H. Glycerol for
Renewable Acrolein Production by Catalytic Dehydration. Renewable and
Sustainable Energy Reviews 2014, 40, 28 – 59.
42. Talebian-Kiakalaieh, A.; Amin, N.
A. S. Kinetic Modeling, Thermodynamic, and Mass-Transfer Studies of
Gas-Phase Glycerol Dehydration To Acrolein over Supported Silicotungstic
Acid Catalyst. Industrial & Engineering Chemistry Research 2015, 54,
8113–8121.
43. Marinelli, T.; Ponec, V. A Study on the Selectivity in
Acrolein Hydrogenation on Platinum Catalysts: a Model for Hydrogenation
of α, β-Unsaturated Aldehydes. Journal of Catalysis 1995, 156, 51 – 59.
44. Mohr, C.; Hofmeister, H.; Lucas, M.; Claus, P. Gold Catalysts for the
Partial Hydrogenation of Acrolein. Chemical Engineering & Technology
2000, 23, 324–328.
45. Volckmar, C. E.; Bron, M.; Bentrup, U.; Martin, A.; Claus, P. Influence
of the Support Composition on the Hydrogenation of Acrolein over
Ag/SiO2-Al2O3 Catalysts. Journal of Catalysis 2009, 261, 1 – 8.
46. de Jesus, J. C.; Zaera, F. Double-bond Activation
in Unsaturated Aldehydes: Conversion of Acrolein To Propene and Ketene on
Pt(111) Surfaces. Journal of Molecular Catalysis A: Chemical 1999, 138, 237
– 240.
47. Wei, H.; Gomez, C.; Liu, J.; Guo, N.; Wu, T.;
Lobo-Lapidus, R.; Marshall, C. L.; Miller, J. T.; Meyer, R. J. Selective
Hydrogenation of Acrolein on Supported Silver Catalysts: a Kinetics Study of
Particle Size Effects. Journal of Catalysis 2013, 298, 18 – 26.
48. Qadariyah, L.; Mahfud,; Sumarno,; Machmudah, S.; Wahyudiono,;
Sasaki, M.; Goto, M. Degradation of Glycerol Using Hydrothermal Process.
Bioresource Technology 2011, 102, 9267 – 9271.
49. Watanabe, M.; Iida, T.; Aizawa, Y.; Aida, T. M.; Inomata, H. Acrolein
Synthesis from Glycerol in Hot-compressed Water. Bioresource Technology
2007, 98, 1285 – 1290.
50. Ott, L.; Bicker, M.; Vogel, H. Catalytic Dehydration of Glycerol in Sub- and
Supercritical Water: a New Chemical Process for Acrolein Production. Green
Chem. 2006, 8, 214–220.
Captions for Figures
| H-ZSM-5 | Pd/H-ZSM-5 | |
| Glycerol | 9.8 | 8.0 |
| Oxygenates | 58.3 | 23.2 |
| Gases | 8.7 | 7.4 |
| Aromatics | 23.2 | 61.4 |
| R1 | R2 | R3 | R4 | |
| ki | 0.278 | 0.923 | 0.045 | 0.741 |